
Table of Contents
Introduction
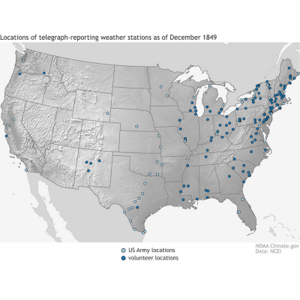
Tracking the movement of weather patterns by plotting variables on maps has a long history, with real-time maps dating back to shortly after the advent of the telegraph (1840s). Even earlier, storm tracks were determined by compiling observations over large distances: Benjamin Franklin described a hurricane that traveled from Philadelphia to Boston in 1743. Today, observations of many variables are recorded every minute at airport-based stations around the U.S. How do we use these data to create weather maps?
The Station Plot
The first step in plotting a surface map is to plot the data for each station. The challenge in showing each station’s data is one of simplifying the large amount of information we wish to display: with several variables of interest at each station (temperature, pressure, dewpoint, wind speed and direction, cloud cover, etc.), there is a lot of information to plot on the map. Meteorologists have developed a conventional way to display all of this information via a visual aid known as the station plot.
General station plot format
A station plot consists of a circle surrounded by several numbers, which represent the values of different weather variables. The circle in the center is plotted at the location of the station. Coming off of the circle is a longer line with one or more shorter, perpendicular lines at its end (shown as “dd” and “ff” above). This represents the wind speed and direction, as described in a previous post.
The commonly plotted variables include temperature on the upper left (“TT” in the image above), dewpoint temperature on the lower left (“TdTd” in the image above), and an abbreviation of the pressure on the upper right (“PPP” in the image above). One, two, or three digits are given for the temperature and dewpoint temperature, and three digits are given for the pressure. Temperature and dewpoint temperature are plotted in degrees Fahrenheit, and pressure is reported to the nearest tenth of a millibar (or tenth of a hectoPascal, which has the same value).
Why did the station plots insist on plotting temperature and dewpoint on the left?
Because they believed in starting the day on the right foot… or should I say, the left plot!
Pressure on the Station Plot
Pressure normally has values from about 970 mb to 1050 mb, though it can be lower in a strong hurricane or higher in a strong high pressure system. So why are only three values plotted on the station plot, when the values can also contain four digits if the pressure is 1000 mb or greater?
The answer is that the pressure on the station plot is abbreviated. The first digit (if the pressure is less than 1000 mb) or two digits (if the pressure is 1000 mb or greater) are removed from the value. The first decimal place is included, without the decimal point. So, for example, a pressure of 994.6 mb is abbreviated “946”, and a pressure of 1016.3 mb is abbreviated “163”.
If the first digit is between 0 and 5, you would add a “10” to the beginning to get the actual pressure value. If the first is between 6 and 9, you would add a “9” to the beginning to get the actual pressure value. Keep this in mind when you’re looking at station plots. Try the brief practice quiz provided here if you’d like to try this conversion for yourself.
Please advance to the next page to continue to the rest of this post.
