
Table of Contents
Introduction: Clouds and Moisture

Clouds are perhaps the most common everyday phenomenon that many people associate with the weather. They stoke one’s imagination, triggering mental images of bunny rabbits, cars, and other animals and inanimate objects by the shapes that they create. Clouds produce precipitation that may make the roads slick, spoil your plans for a picnic, or postpone your softball game. Clouds also give rise to nature’s fury, producing hail, wind, and tornadoes.
At its most fundamental, understanding cloud formation requires an understanding of the phase changes of water that produce the liquid droplets and ice crystals from which clouds are made. At a deeper layer of sophistication, an understanding of cloud formation lends insight into some basic principles of meteorology that govern many other atmospheric processes.
For a rich understanding of clouds, one must be able to connect visual observations with data. An understanding of the variables used to quantify atmospheric moisture provides background that is essential in comprehending how clouds form. Skew-T diagrams provide a useful tool to visualize these variables.
Topics covered in this chapter
Theoretical underpinnings
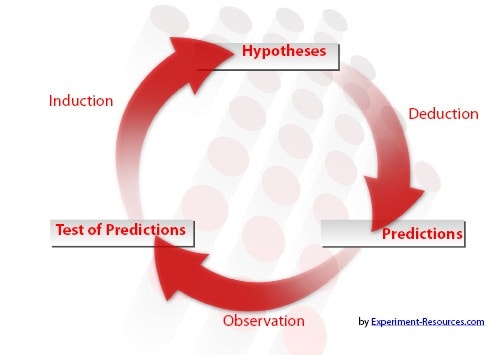
![[Summary of cloud formation]](https://understandingtheweather.org/wp-content/uploads/2023/05/phasechanges4-1.jpg)
Fundamental to the study of meteorology are phase changes of water such as melting and freezing, evaporation and condensation, and sublimation and deposition. The effects of these phase changes on environmental temperature are also key to understanding many meteorological processes.
The recipe for cloud formation:
Two foundational ideas are essential in understanding how clouds form: saturation and vertical motion. Saturation produces the liquid droplets and ice crystals that compose clouds, while vertical motion (lifting the air) provides a physical mechanism to create saturated conditions.
Practical applications
![[Cloud classification]](https://upload.wikimedia.org/wikipedia/commons/thumb/5/57/Cloud_types_en.svg/300px-Cloud_types_en.svg.png)
Being able to identify cloud types based on their structure and height is an important skill in relating everyday weather to meteorological concepts.
Skew-T diagrams provide a convenient way to visualize meteorological data relating to atmospheric processes, such as saturation.
Synthesizing theory and applications
Making connections between data and cloud observations gives novices and experienced meteorologists alike the opportunity to apply their knowledge of these atmospheric processes to real-world situations.
Moisture variables, such as dewpoint temperature and relative humidity, quantify water vapor in the atmosphere and provide the means to build a framework for saturation as the driver of cloud formation.
Revisiting cloud formation with a more sophisticated approach, thanks to the tools acquired throughout this chapter, introduces deeper concepts that will be applied and expanded in future chapters.

Connections to Other Chapters
Skew-T diagrams will be used in many different contexts. Some applications of these charts include identifying the height of the tropopause[link], diagnosing wind shear[link], assessing the stability of the atmosphere[link], and describing conditions associated with severe weather[link]. Many more advanced applications of skew-T diagrams are covered in upper level meteorology courses. As you can see, these plots are vital to meteorologists for both forecasting and research.
The processes that help to form clouds are an important part of understanding stability[link] in the atmosphere. Stability and cloud formation go hand-in-hand, as relatively unstable conditions are required for most clouds to form. This course employs a “spiral staircase” approach to the content, laying the groundwork in this chapter and adding layers of complexity in later chapters.
Two chapters[link] are devoted to cloud microphysics: the processes involved in the production of cloud droplets, raindrops, and ice crystals. Topics introduced in this chapter, such as dewpoint temperature, relative humidity, and saturation, will be explored in greater depth.

You must be logged in to post a comment.