
Table of Contents
Introduction
Did you know that there is more than one kind of mile? The miles you see on road signs in the US are statute miles, or land miles. Historically, ships have navigated using nautical miles instead. When measuring wind speeds, meteorologists often use nautical miles per hour, which are also known as a knot. One knot is equal to 1.15 miles per hour. The term “knot” comes from an older method of measuring speed of a traveling ship using knots in a rope to determine the ship’s speed as the ship was traveling.
Wind Background
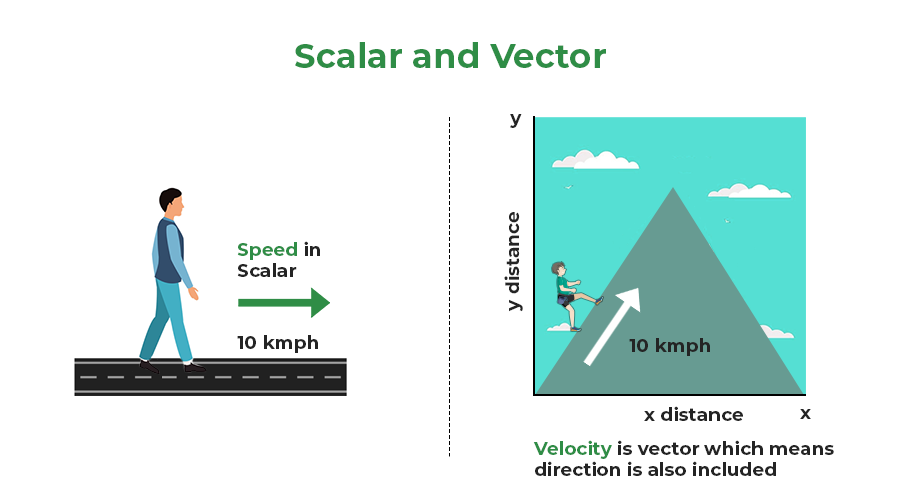
Measurements of wind differ from measurements of other variables such as pressure, temperature, and humidity in that wind is a vector quantity, while these other variables are scalar quantities. Vectors have both a direction and a magnitude associated with them, while scalars have only a magnitude. In order to quantify (measure) the wind, we need to report both its speed and its direction, which requires two means of measurement, either with one device that combines the two measurements or via two devices that measure wind speed and direction separately.
Why did the wind get invited to the math party?
Because it was a vector, not a scalar! It had both magnitude and direction, making it the life of the party, while those scalars were just blowing hot air!
By convention, meteorologists report the wind direction as the direction the wind is coming from, not the direction it is moving toward. This convention is likely due to the nature of weather forecasting before the invention of the telegraph: weather enthusiasts and early meteorologists were more interested in where the weather was coming from – and what weather to expect – than where it was going.
Can you measure the wind speed just by looking at objects blowing in the wind?
YES! The Beaufort scale rates the wind speed based on the force that the movement of the wind applies to trees and the ocean’s surface. The more that branches and trees sway, and the more that the ocean water is disturbed, the stronger the wind speed. Admiral Sir Francis Beaufort (1774-1857) was a British naval officer who spent a great deal of time observing the wind and developing his scale.
Wind-Measuring Devices
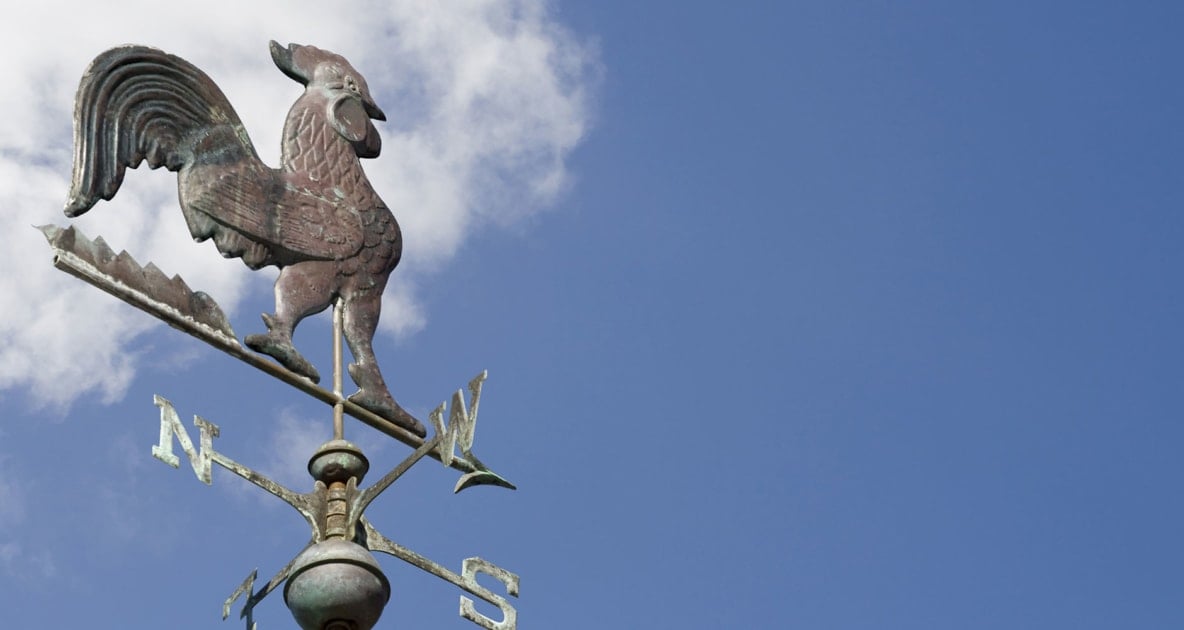
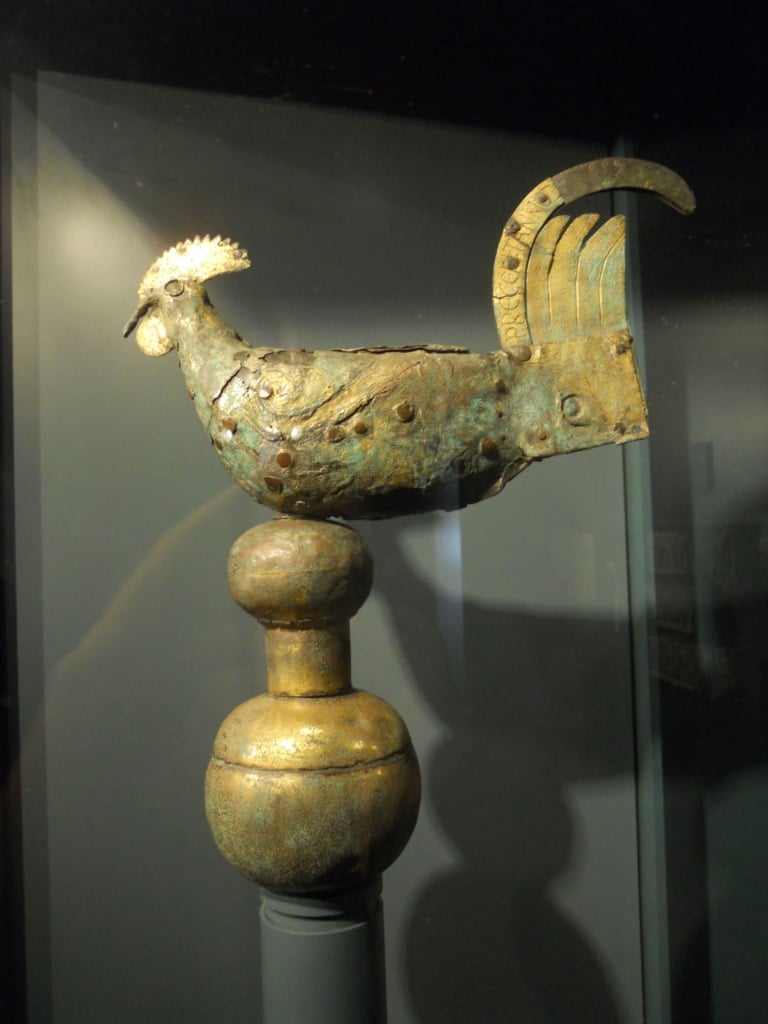
Wind direction is commonly measured using a device known as a wind vane, and the wind speed is measured using an anemometer. The oldest existing weathervane (shown below) dates back to between 820 and 830 AD, and was built in Brecia, Italy. Traditional wind vanes are often shaped like roosters (like the ones above and below); the arrow above points in the direction the wind is coming from. Incidentally, the history of why weathervanes have an association with roosters is fascinating!
Case study: Where did the air that spawned the March 25, 2021 Newnan, GA tornado come from?
The air came from different places at different heights in the storm. The air at 500 m above sea level in the storm was sourced from the Florida panhandle and the Gulf of Mexico (green line below). At 2500 m, the air also came from the Gulf, but farther west (blue line). It rose and fell as it crossed southern Alabama (see lower graph). And at 7500 m, the air had traveled from western Mexico and crossed the Sierra Madre Occidental Mountains of Mexico before reaching Georgia (red line).
The lowest winds are from the south, and with increasing height the winds turn more westerly (from the west). This pattern of winds turning clockwise with height (known as veering) is common in the atmosphere. In this case, warm, moist air from the Gulf appears at low levels, while air that has been dried out in crossing the mountains of Mexico appears at mid-levels. This signature of warm, moist low level air and cool, dry mid-level air is common for severe weather, especially in the eastern US.
Source: https://images.fineartamerica.com
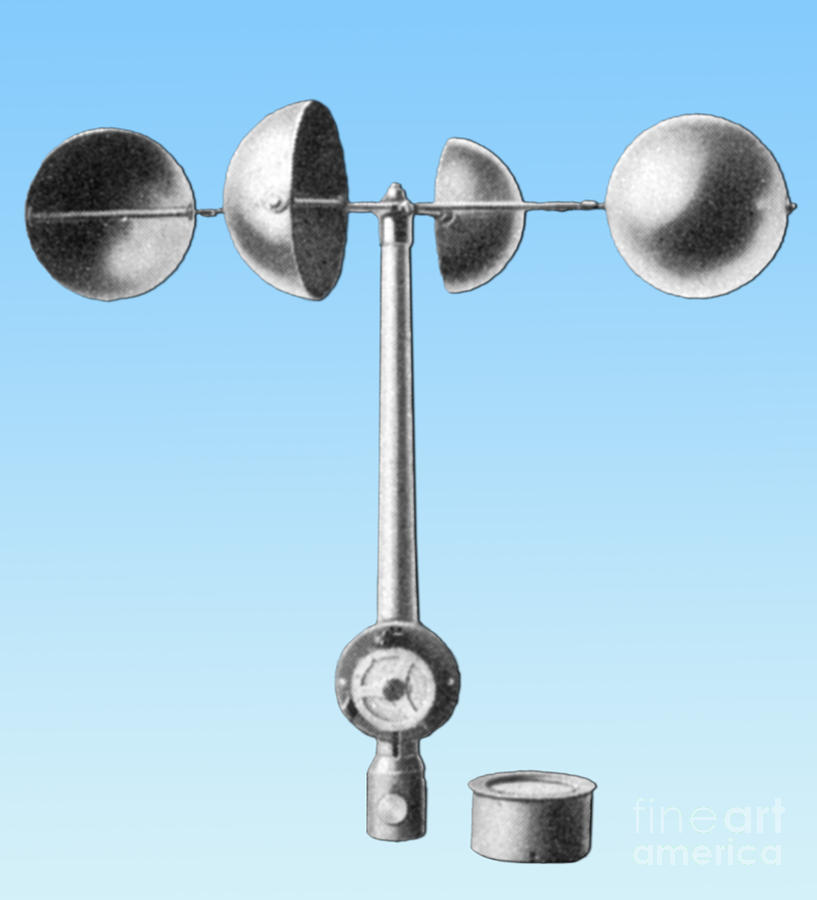
There are many kinds of anemometers to measure the wind speed; the most common is the cup anemometer (see photo above). Cup anemometers consist of three or four cups which spin around a central pole more or less rapidly depending on the strength of the wind. A more modern device that combines measurements of wind speed and wind direction, using a propeller that is spun by the winds and rotates on an axis to indicate the wind direction, is known as an aerovane.

Source: Wikipedia
Wind direction may be reported as the compass direction (north, southwest, east-northeast, etc.) that the wind is coming from. It may also be reported in compass degrees. There are 360 degrees on the compass. North is 0 or 360 degrees; east is 90 degrees; south is 180 degrees; and west is 270 degrees. See the image below for compass directions and their corresponding degrees.

Source: http://www.land-navigation.com/boxing-the-compass.html
Meteorologists use naming conventions to specify the direction of the wind. If the wind is reported as northward, southward, eastward, or westward, the wind is moving toward the direction named. More commonly, meteorologists use terms like northerly, southerly, easterly, and westerly. In this case, the term refers to the direction the wind is coming from. For example, a westerly wind is coming from the west.
Representing Winds on Maps
Meteorologists use symbols on maps and graphs to depict wind speed and direction. Calm wind (an absence of wind) is indicated by a small circle. If there is wind, the symbols consist of a long staff that points in the direction that the wind is coming from and one or more small barbs at the end of the staff that indicate the wind speed.
Each long barb represents 10 knots, and a short barb represents 5 knots. A triangle, commonly referred to as a “flag”, represents 50 knots. To determine the wind speed, simply add the barbs and flags. For example, a flag with three long barbs and a short barb would indicate a wind speed of 50+30+5=85 knots.

Source: https://spatiallychallenged.com/
Beyond Wind
In other posts, you can read about measurements of temperature, pressure, and humidity. Together, these four variables are called state variables because they indicate the basic state of the atmosphere at a given time. We measure other variables, though, such as precipitation type and amount, visibility, cloud height, and cloud coverage. Click to find out how we plot these data on maps and graphs.

You must be logged in to post a comment.